System Metrics
Temperature & Sensors
Click the Temperature button on the home screen to view your system's temperature and power sensor readings. This feature is currently available on Windows & Mac. The real-time temperature (°C) and power draw (Watts) of your CPU and GPU will be displayed.
Most recent hardware has supported sensors. We are continually adding support for new hardware.
Logging & Charting
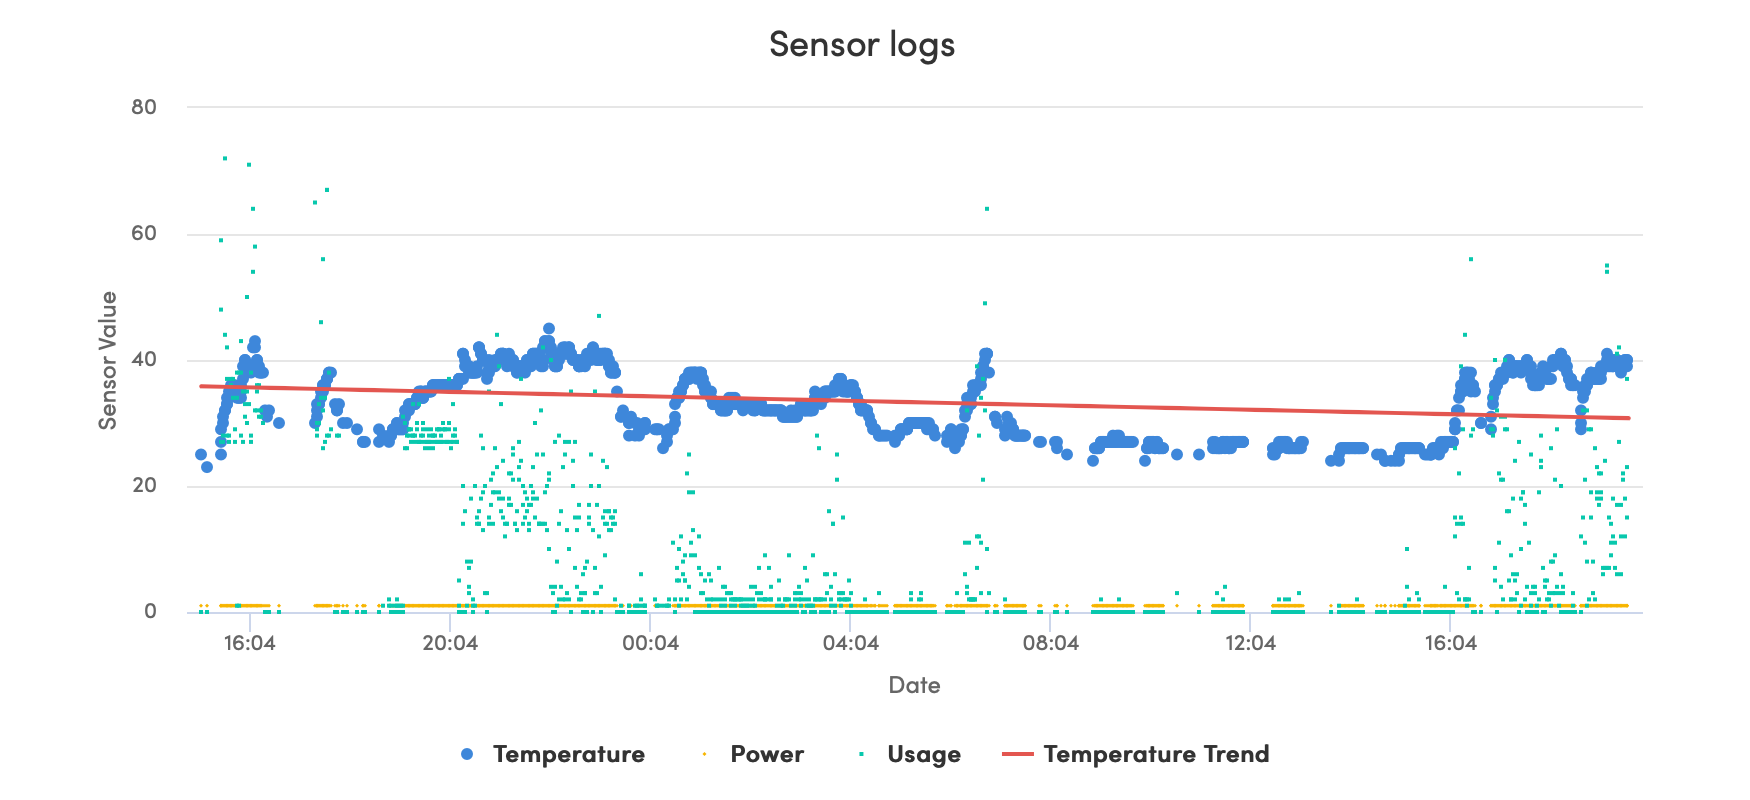
When sensor logging is enabled, the sensor chart will display a history of your system's temperature, power draw, and usage. This can be useful for tracking your system's metrics over time, or for troubleshooting overheating issues.
Change the chart's time range by clicking the buttons at the bottom of the chart. The chart will display a temperature trend line for easy interpretation.