Understanding Benchmark Results
Comparing your Benchmark Results
Getting Started
After testing, your benchmark results are analyzed and your computer is given a Novabench Score.
The overall score - the largest number at the top of the results page - is an impression of your computer's performance relative to other computers scored by Novabench. It is the sum of weighted sub-scores for each major part of your computer: CPU, GPU, RAM, and Disk.
A Novabench Score has no upper limit - a higher score is better. Scores are designed to be linearly comparable; a CPU that has a score of 2x another is roughly twice as fast, for the common workloads that Novabench tests.
Basic online comparion
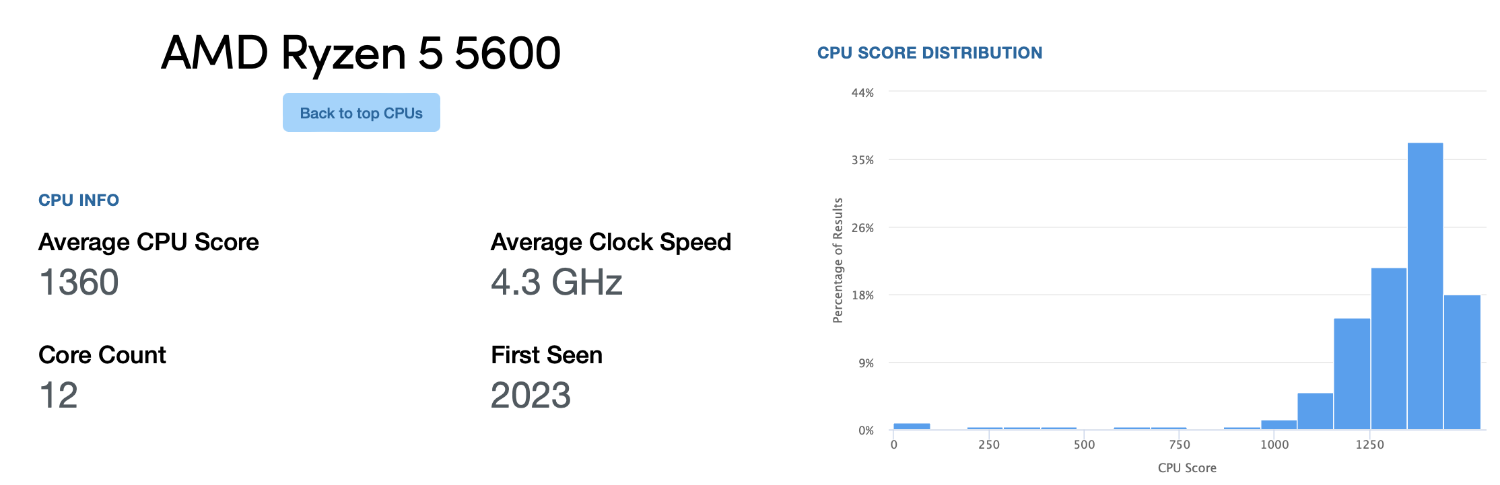
Under the Online Comparison tab of your test result, quick links are provided to search the Novabench online parts database for your CPU and GPU. The search results will show you the average Novabench score for your part. Click the part to open it on Novabench.com, for more detailed information.
The part page shows the distribution of benchmark scores for a this CPU or GPU. Many factors influence how the part performs. A part may test below average due to thermal or power limits, high activity by other running programs, or misconfiguration. The higher end of the curve may be overclocked parts. Examine the score distribution for your part, and see how your score fits within it.
Advanced online comparison

Relative comparison
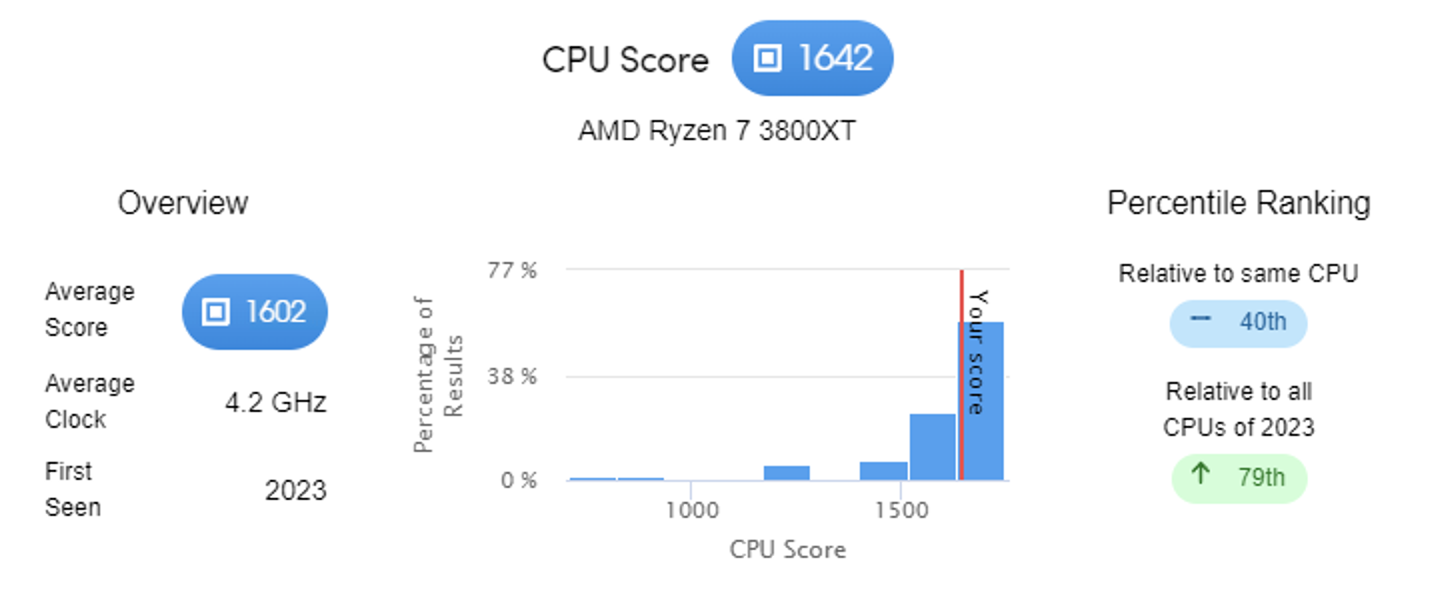
The relative comparison tool shows a more indepth view of how a system's CPU and GPU are performing relative to equivalent parts tested by other users.
The percentile ranking of your CPU or GPU indicates how many tests results for the same part fell below yours. For example, if your CPU scores at the 99th percentile, 99% of the results for the same CPU are lower than years. A percentile ranking is also given for all parts benchmarked in the same year that your part was released. This is helpful for comparing your part to its contemporaries, to assess the relative performance and longevity of your hardware.
Baseline comparison
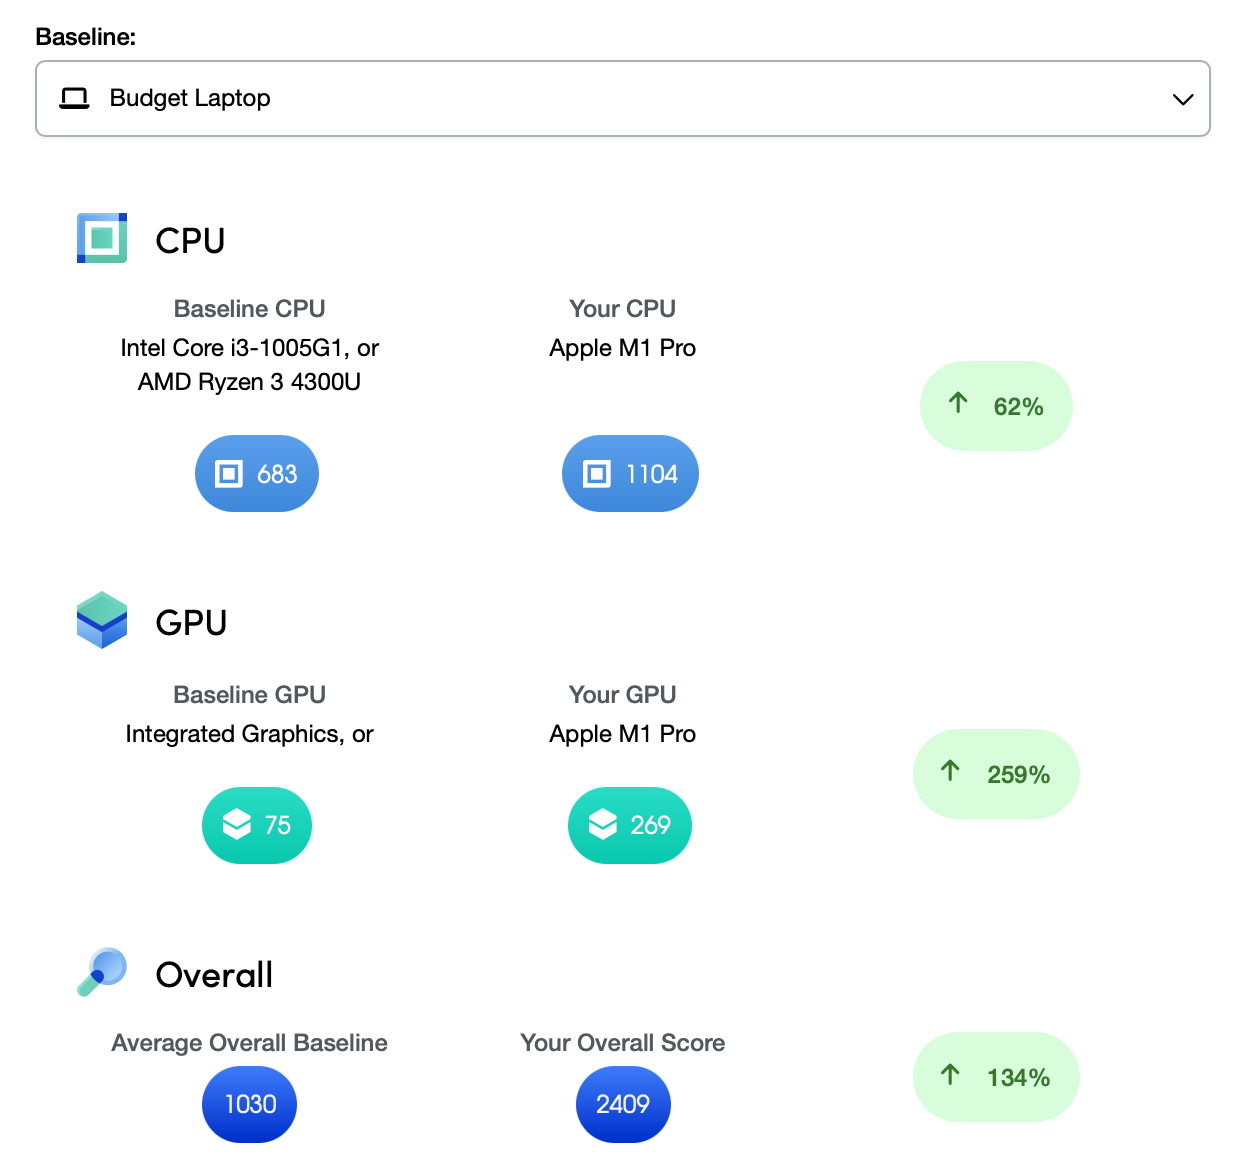
The baseline comparison tool provides a way for you to compare your benchmark results with those of established baseline systems. This tool can help you understand how your system measures up against common system configurations used by a variety of users.
Select a baseline system from the dropdown. Novabench provides a list of common baseline systems for you to choose from. These baseline systems range from low-performance systems to high-performance ones, each configured for different use cases. The comparison will show you how your CPU, GPU, and Storage performance measures up against the selected baseline. If your component scores are higher than the baseline, it means your system outperforms the baseline in those aspects.
Temperature comparison
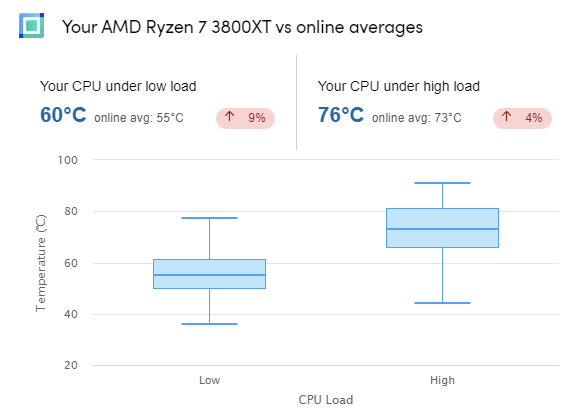
The temperature comparison tool helps to determine if this system is cooled effectively, by comparing the temperature and power readings of your system's CPU and GPU to those tested by other users.
For your CPU and GPU, a box plot is shown for the recorded temperature ranges of your CPU and GPU, as tested by other users, for high and low loads. The box represents the interquartile range (the middle 50% of temperatures), while the line inside the box represents the median temperature. The "whiskers" (lines extending from the box) indicate the overall range of temperatures, excluding outliers.
Your system's temperatures: Your system's temperature readings are displayed above the box plot. This allows you to easily compare your temperature against the overall range of temperatures. If the temperature displayed is above the median, it may indicate an issue with your cooling solution. Conversely, if the temperature displayed is closer to the lower whisker of the box plot or beyond, it suggests that your system is well-cooled.
Remember, temperature is a crucial aspect of system performance. Overheating can lead to reduced component lifespan, throttled performance, and in extreme cases, system failure. If your system's temperatures are consistently high, it may be worth exploring more efficient cooling solutions or investigating potential issues with your current setup.