Monitoring
Track system performance time
Monitor temperatures, power draw, and battery health. Schedule recurring performance and network tests to catch issues early.
Other downloads
No ads, no bloat
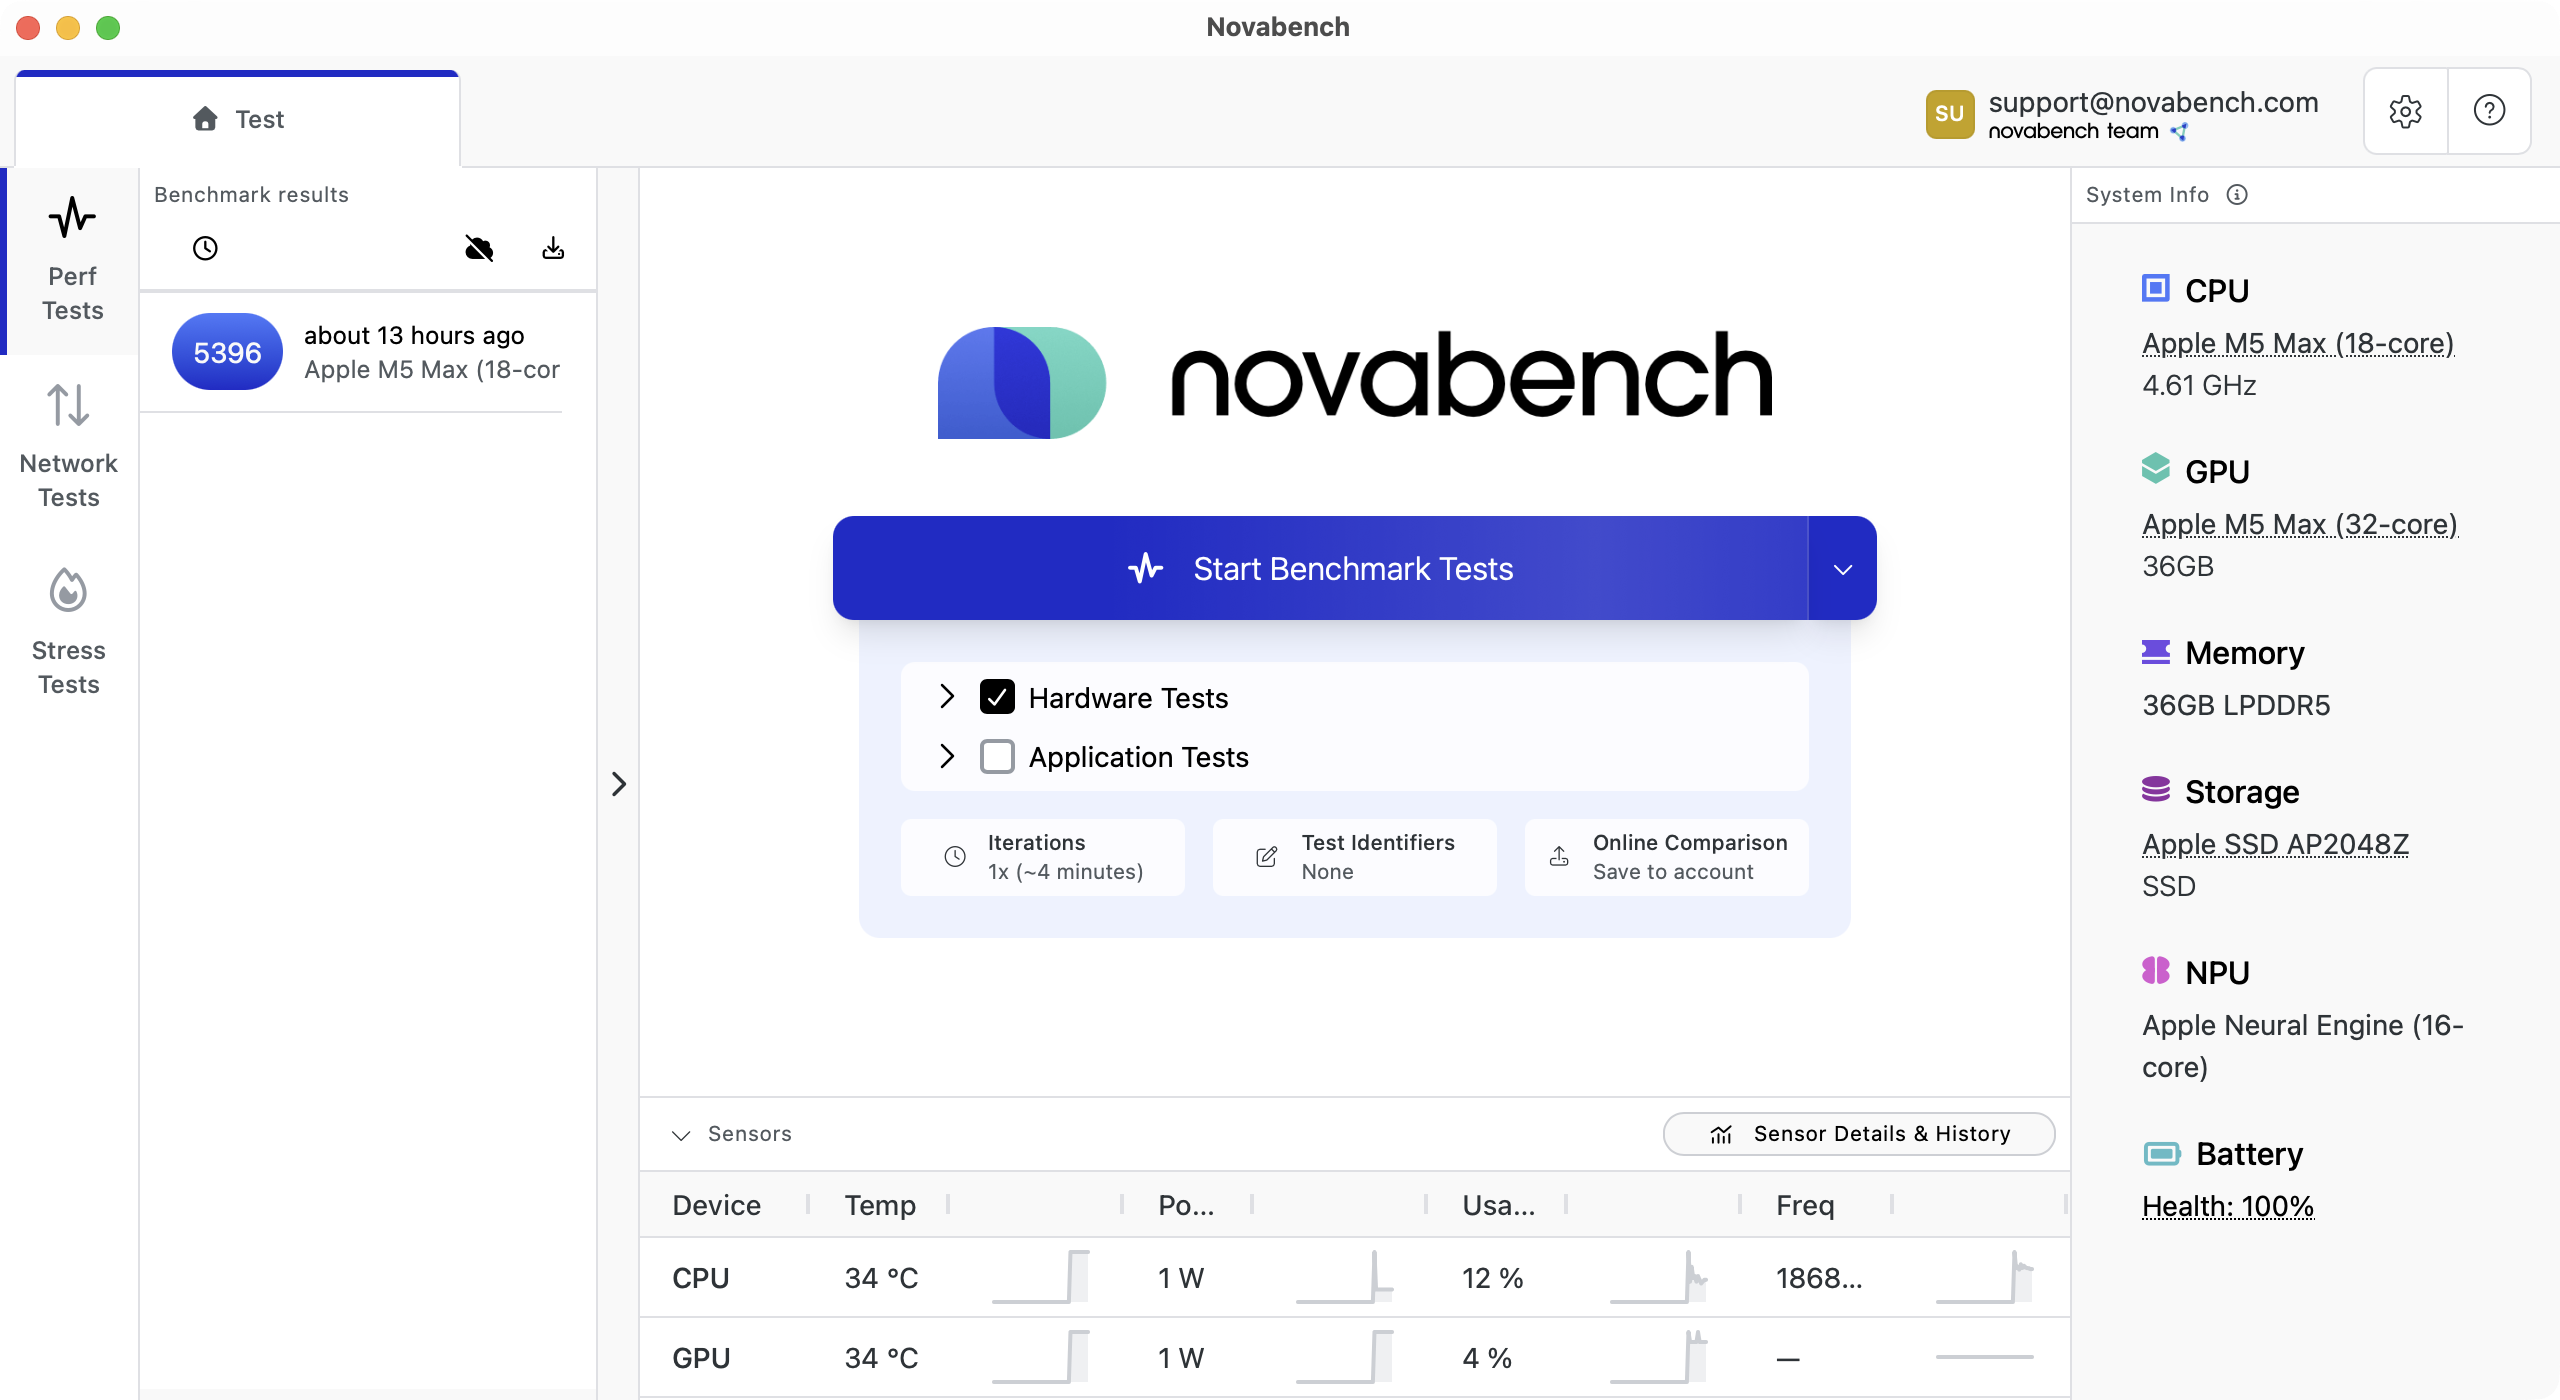
What you can track
- CPU and GPU temperatures, power draw, utilization, and clock speeds
- Battery health - capacity degradation, cycle count, and wear level
- Historical sensor and system usage trends
- Scheduled benchmarks and network tests
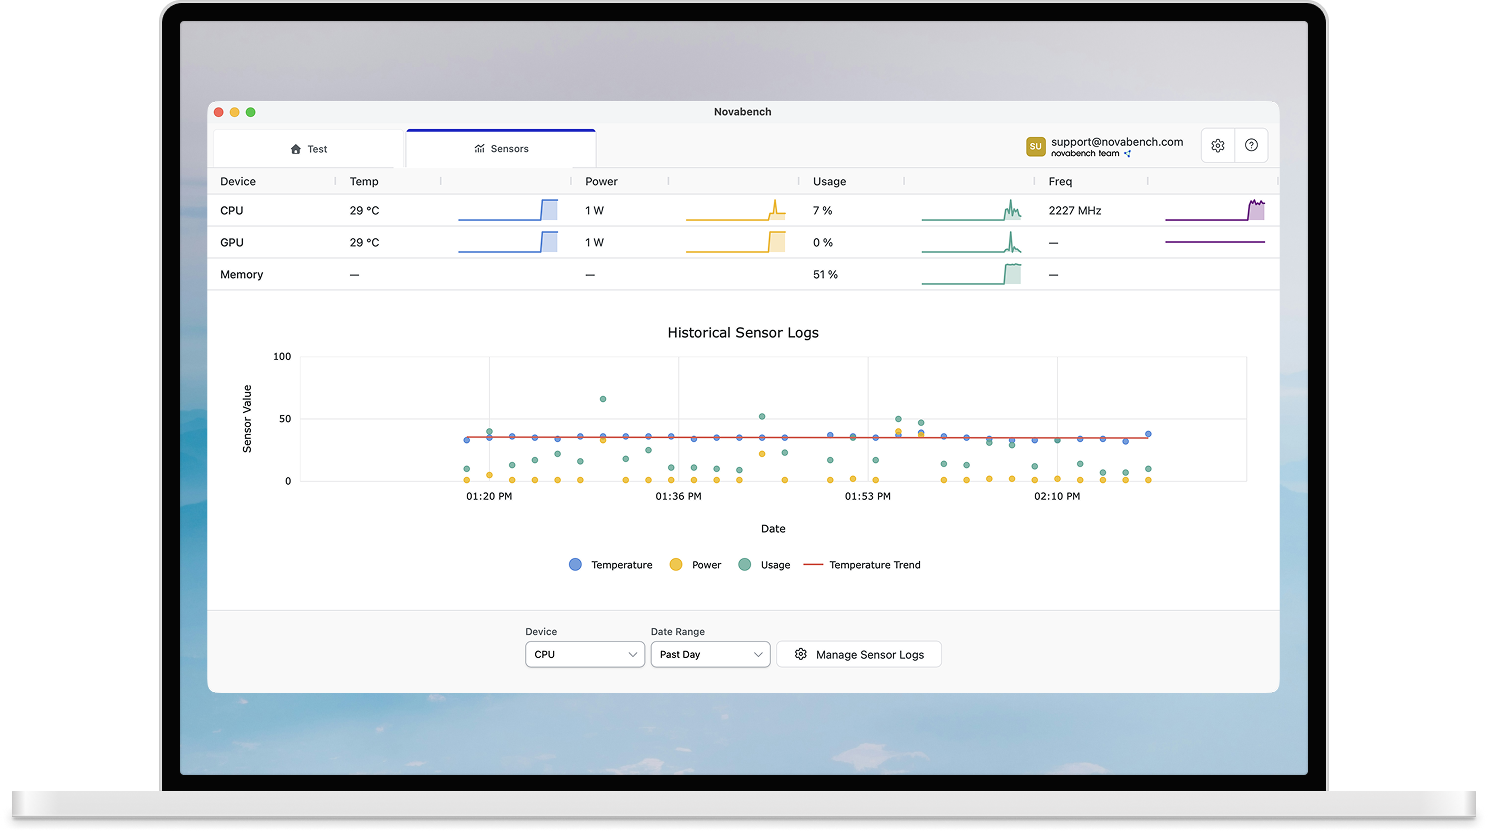
Live sensor readings
Novabench reads CPU and GPU temperatures, power draw, utilization, and clock speeds directly from your hardware.
- CPU and GPU temperature, power, utilization, and clock speed
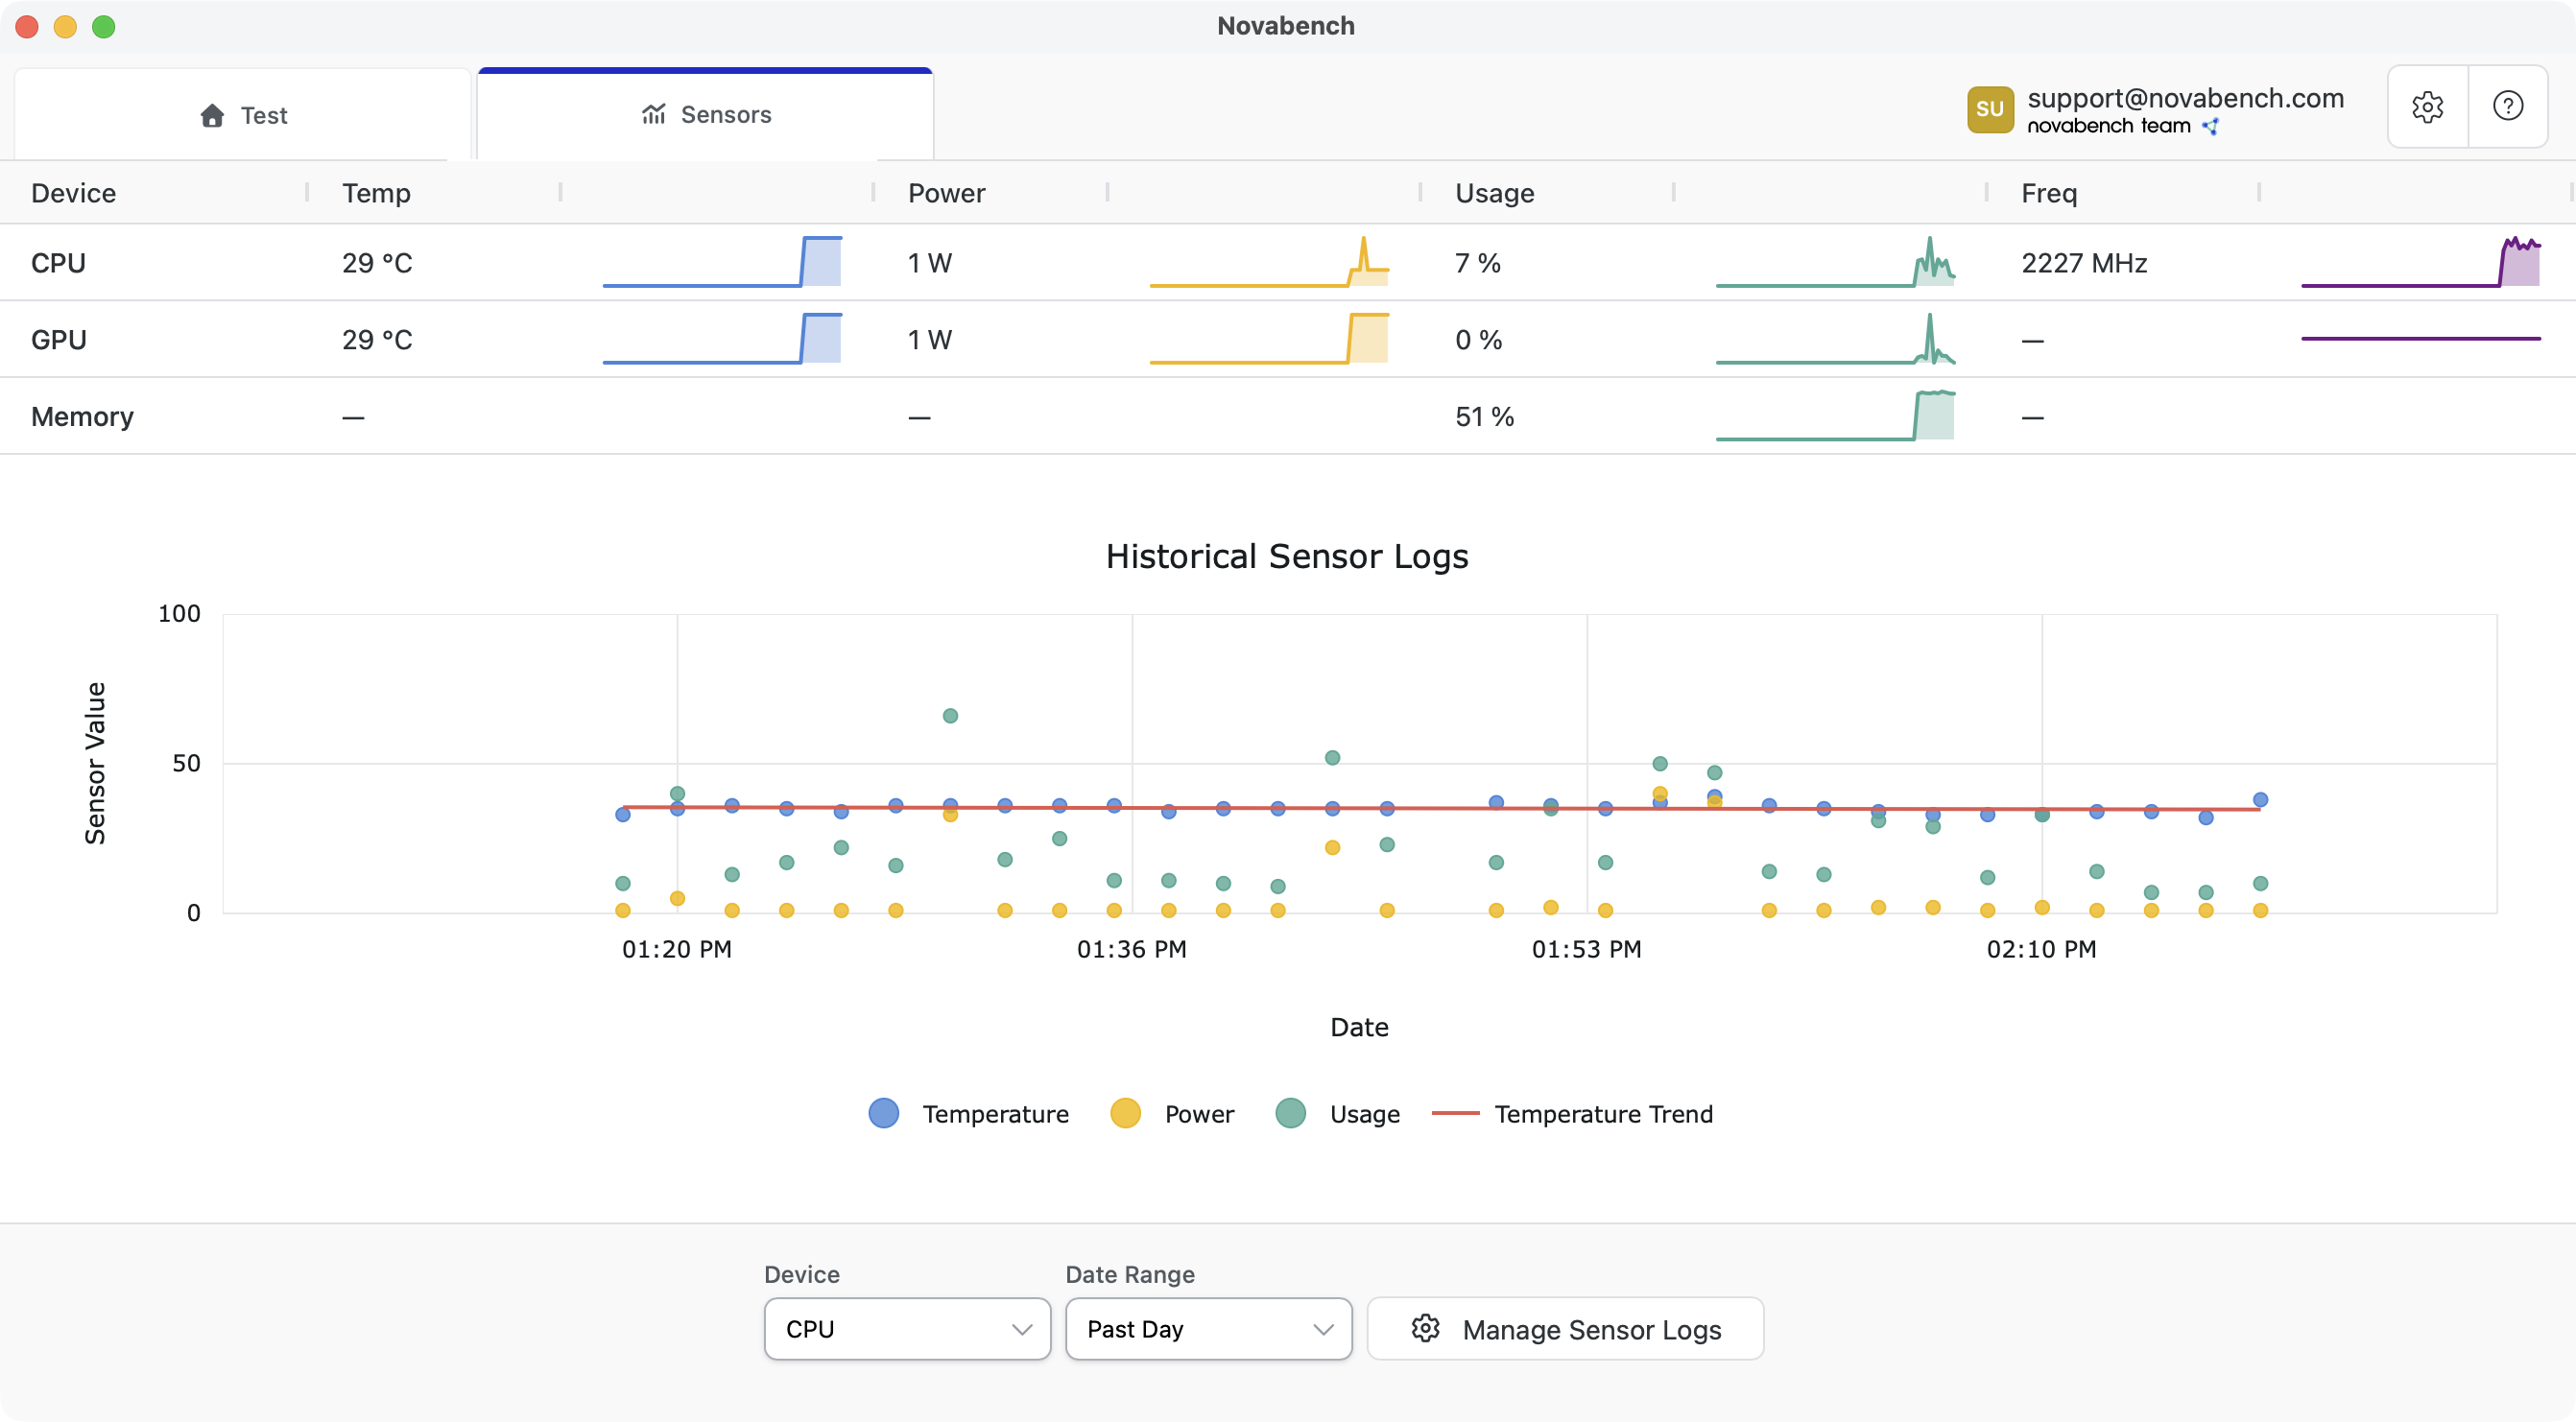
Sensor history over time
View trends in your system usage and cooling over time.
- Automatic logging and charting
- Min, max, average, and 90th percentile statistics
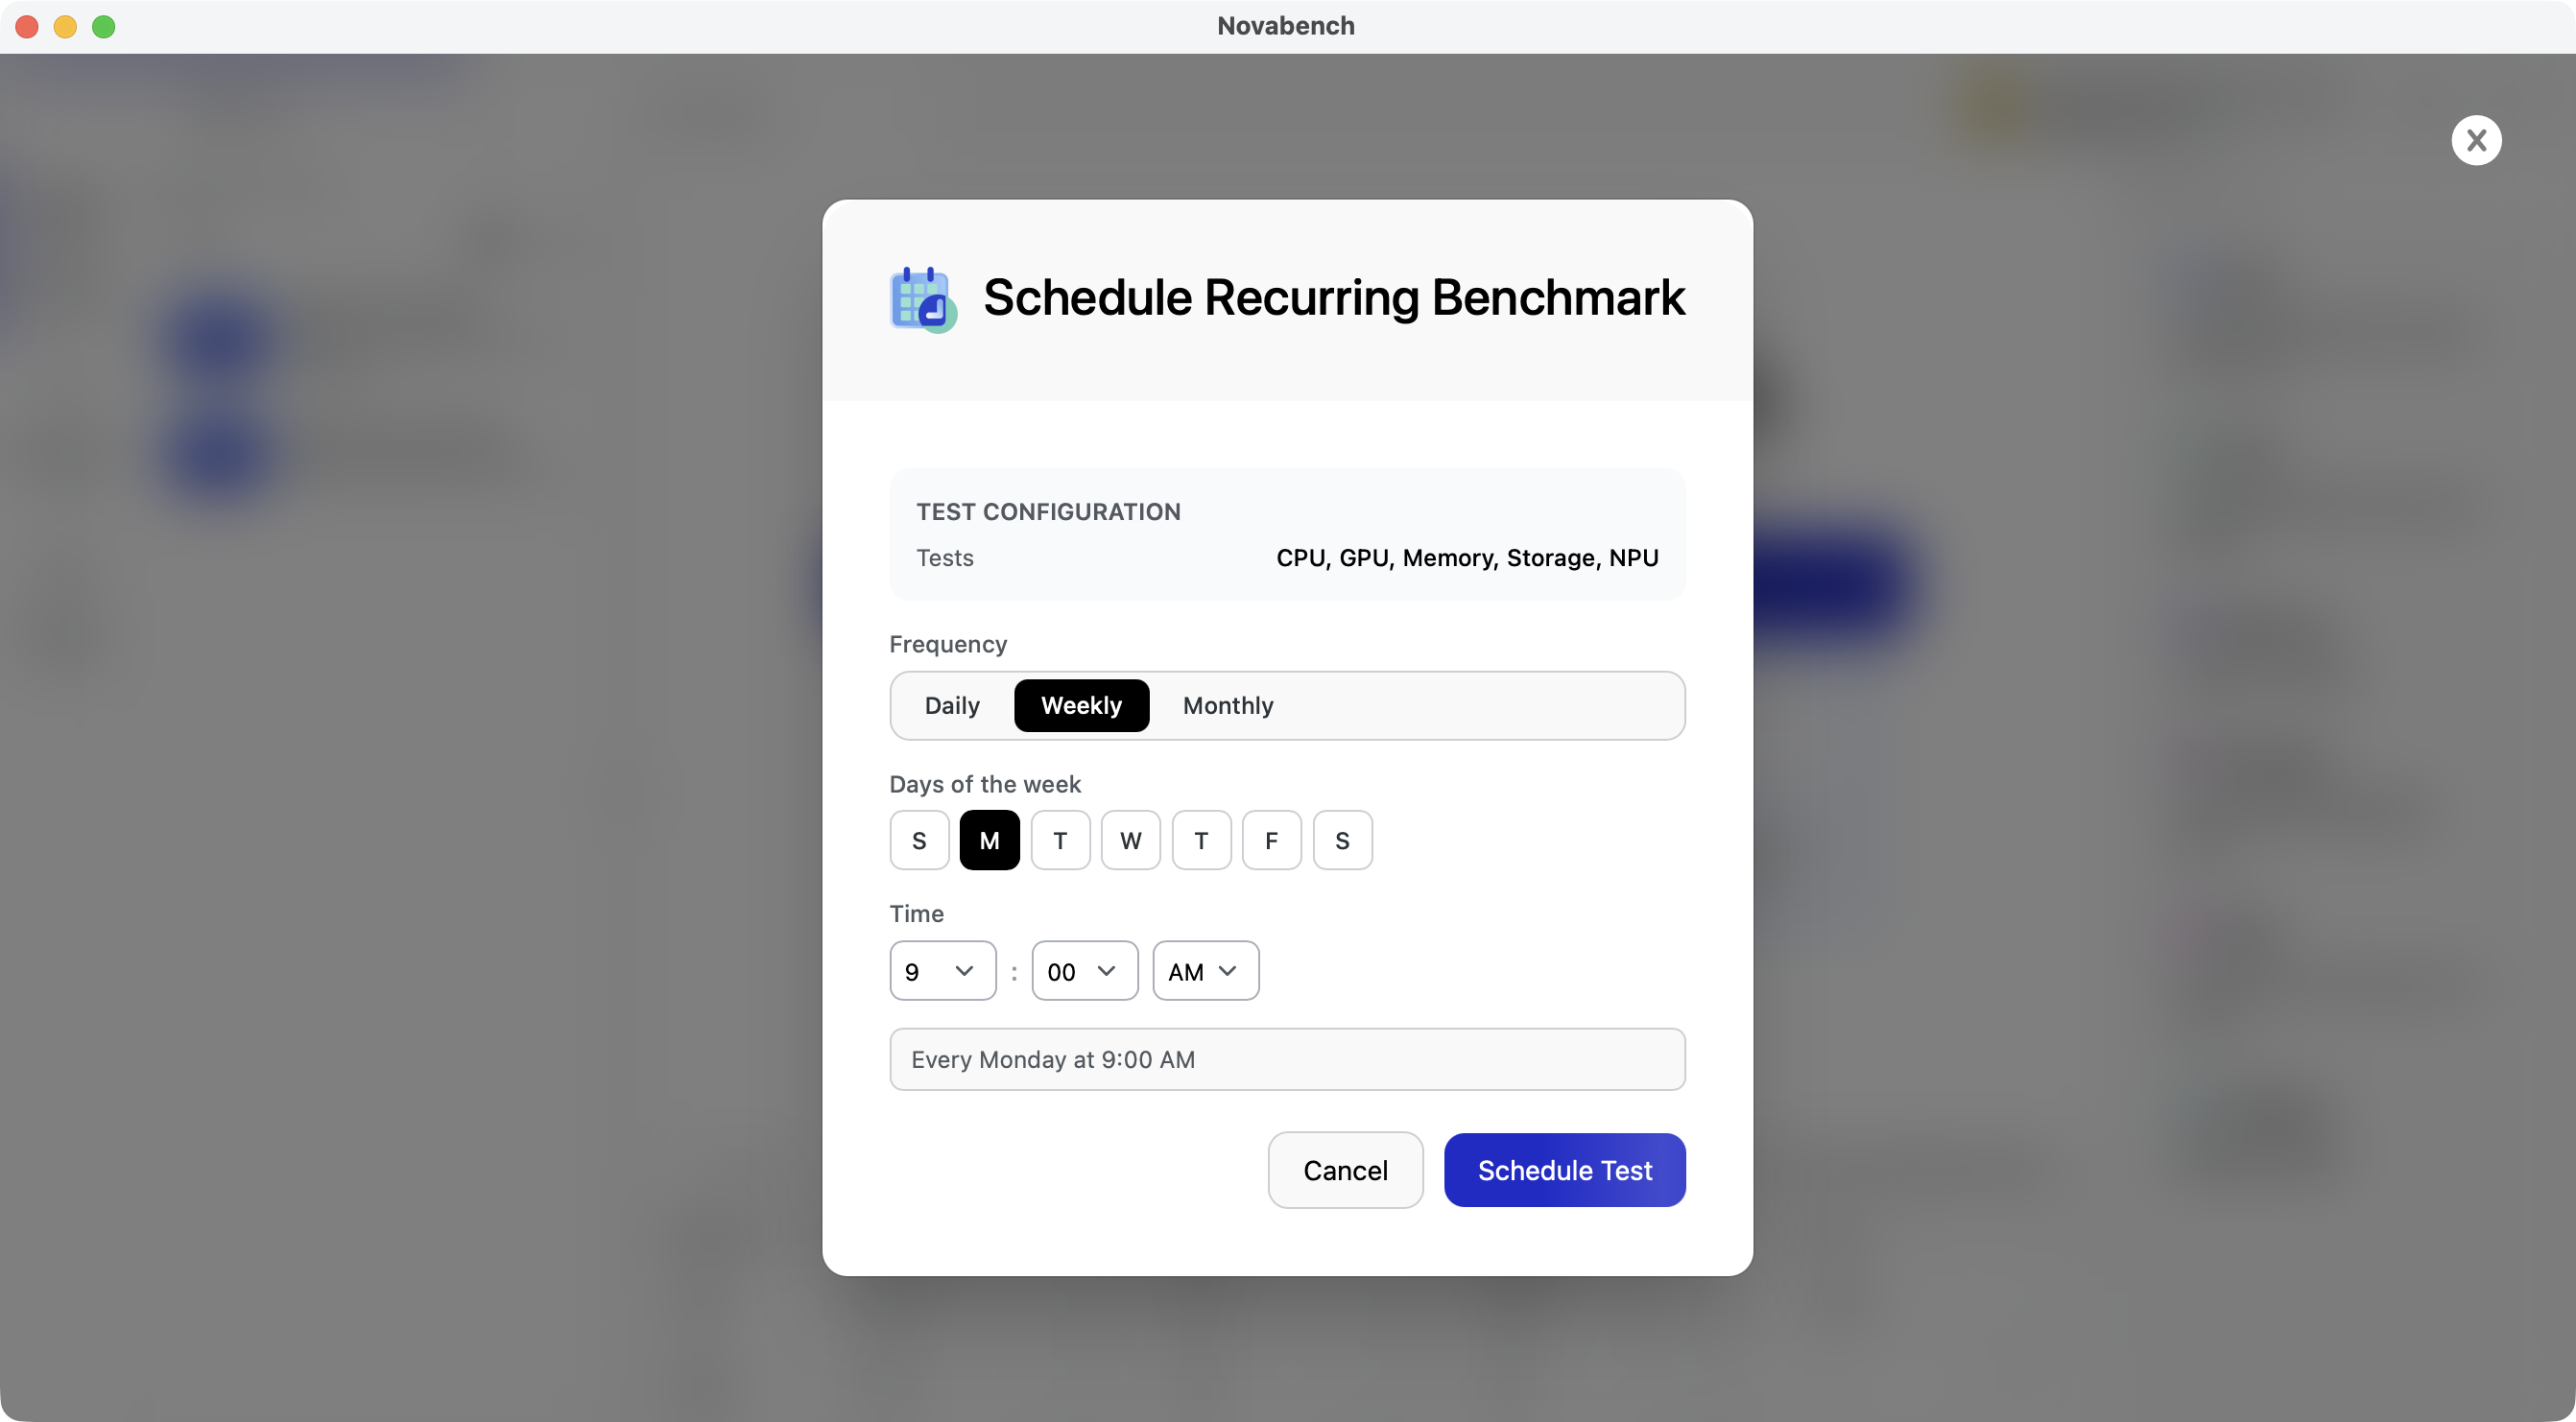
Recurring performance and network tests
Set up tests that run automatically on any schedule. Track scores over time and catch issues as they happen.
- Schedule benchmarks or network tests
- Daily, weekly, or monthly frequency with custom timing
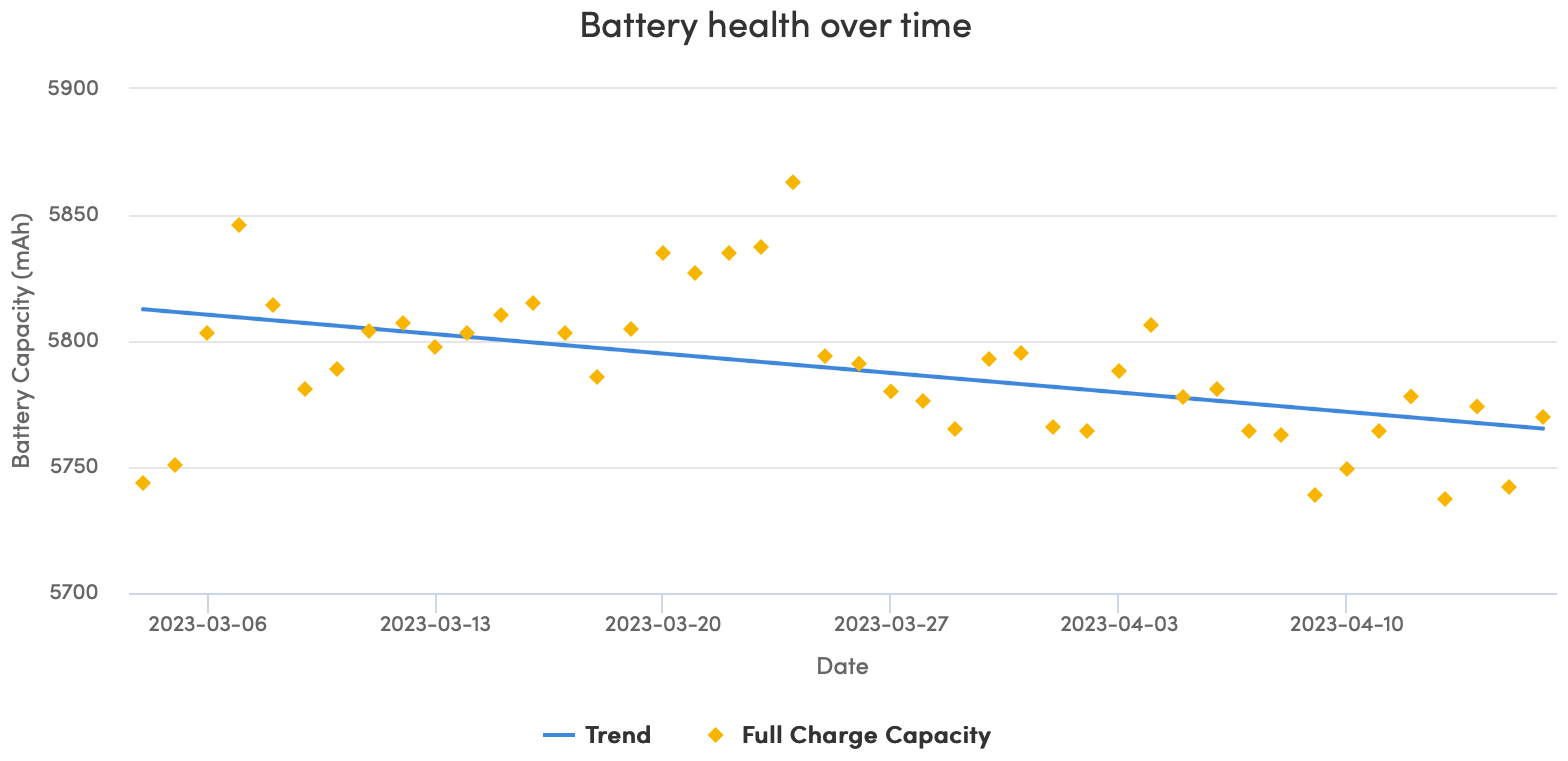
Battery health tracking
Battery chemistry degrades over time and with use. Track and chart your laptop battery capacity to catch premature wear, or see when it needs to be replaced.
- Design vs current capacity comparison
- Cycle count and wear level tracking
- Capacity trend over time