- Benchmark test
- Storage test
Benchmark your storage
Novabench measures sequential and random read/write speeds on the drive, reads S.M.A.R.T. health values, and indicates issues that may be limiting performance.
What the storage test measures
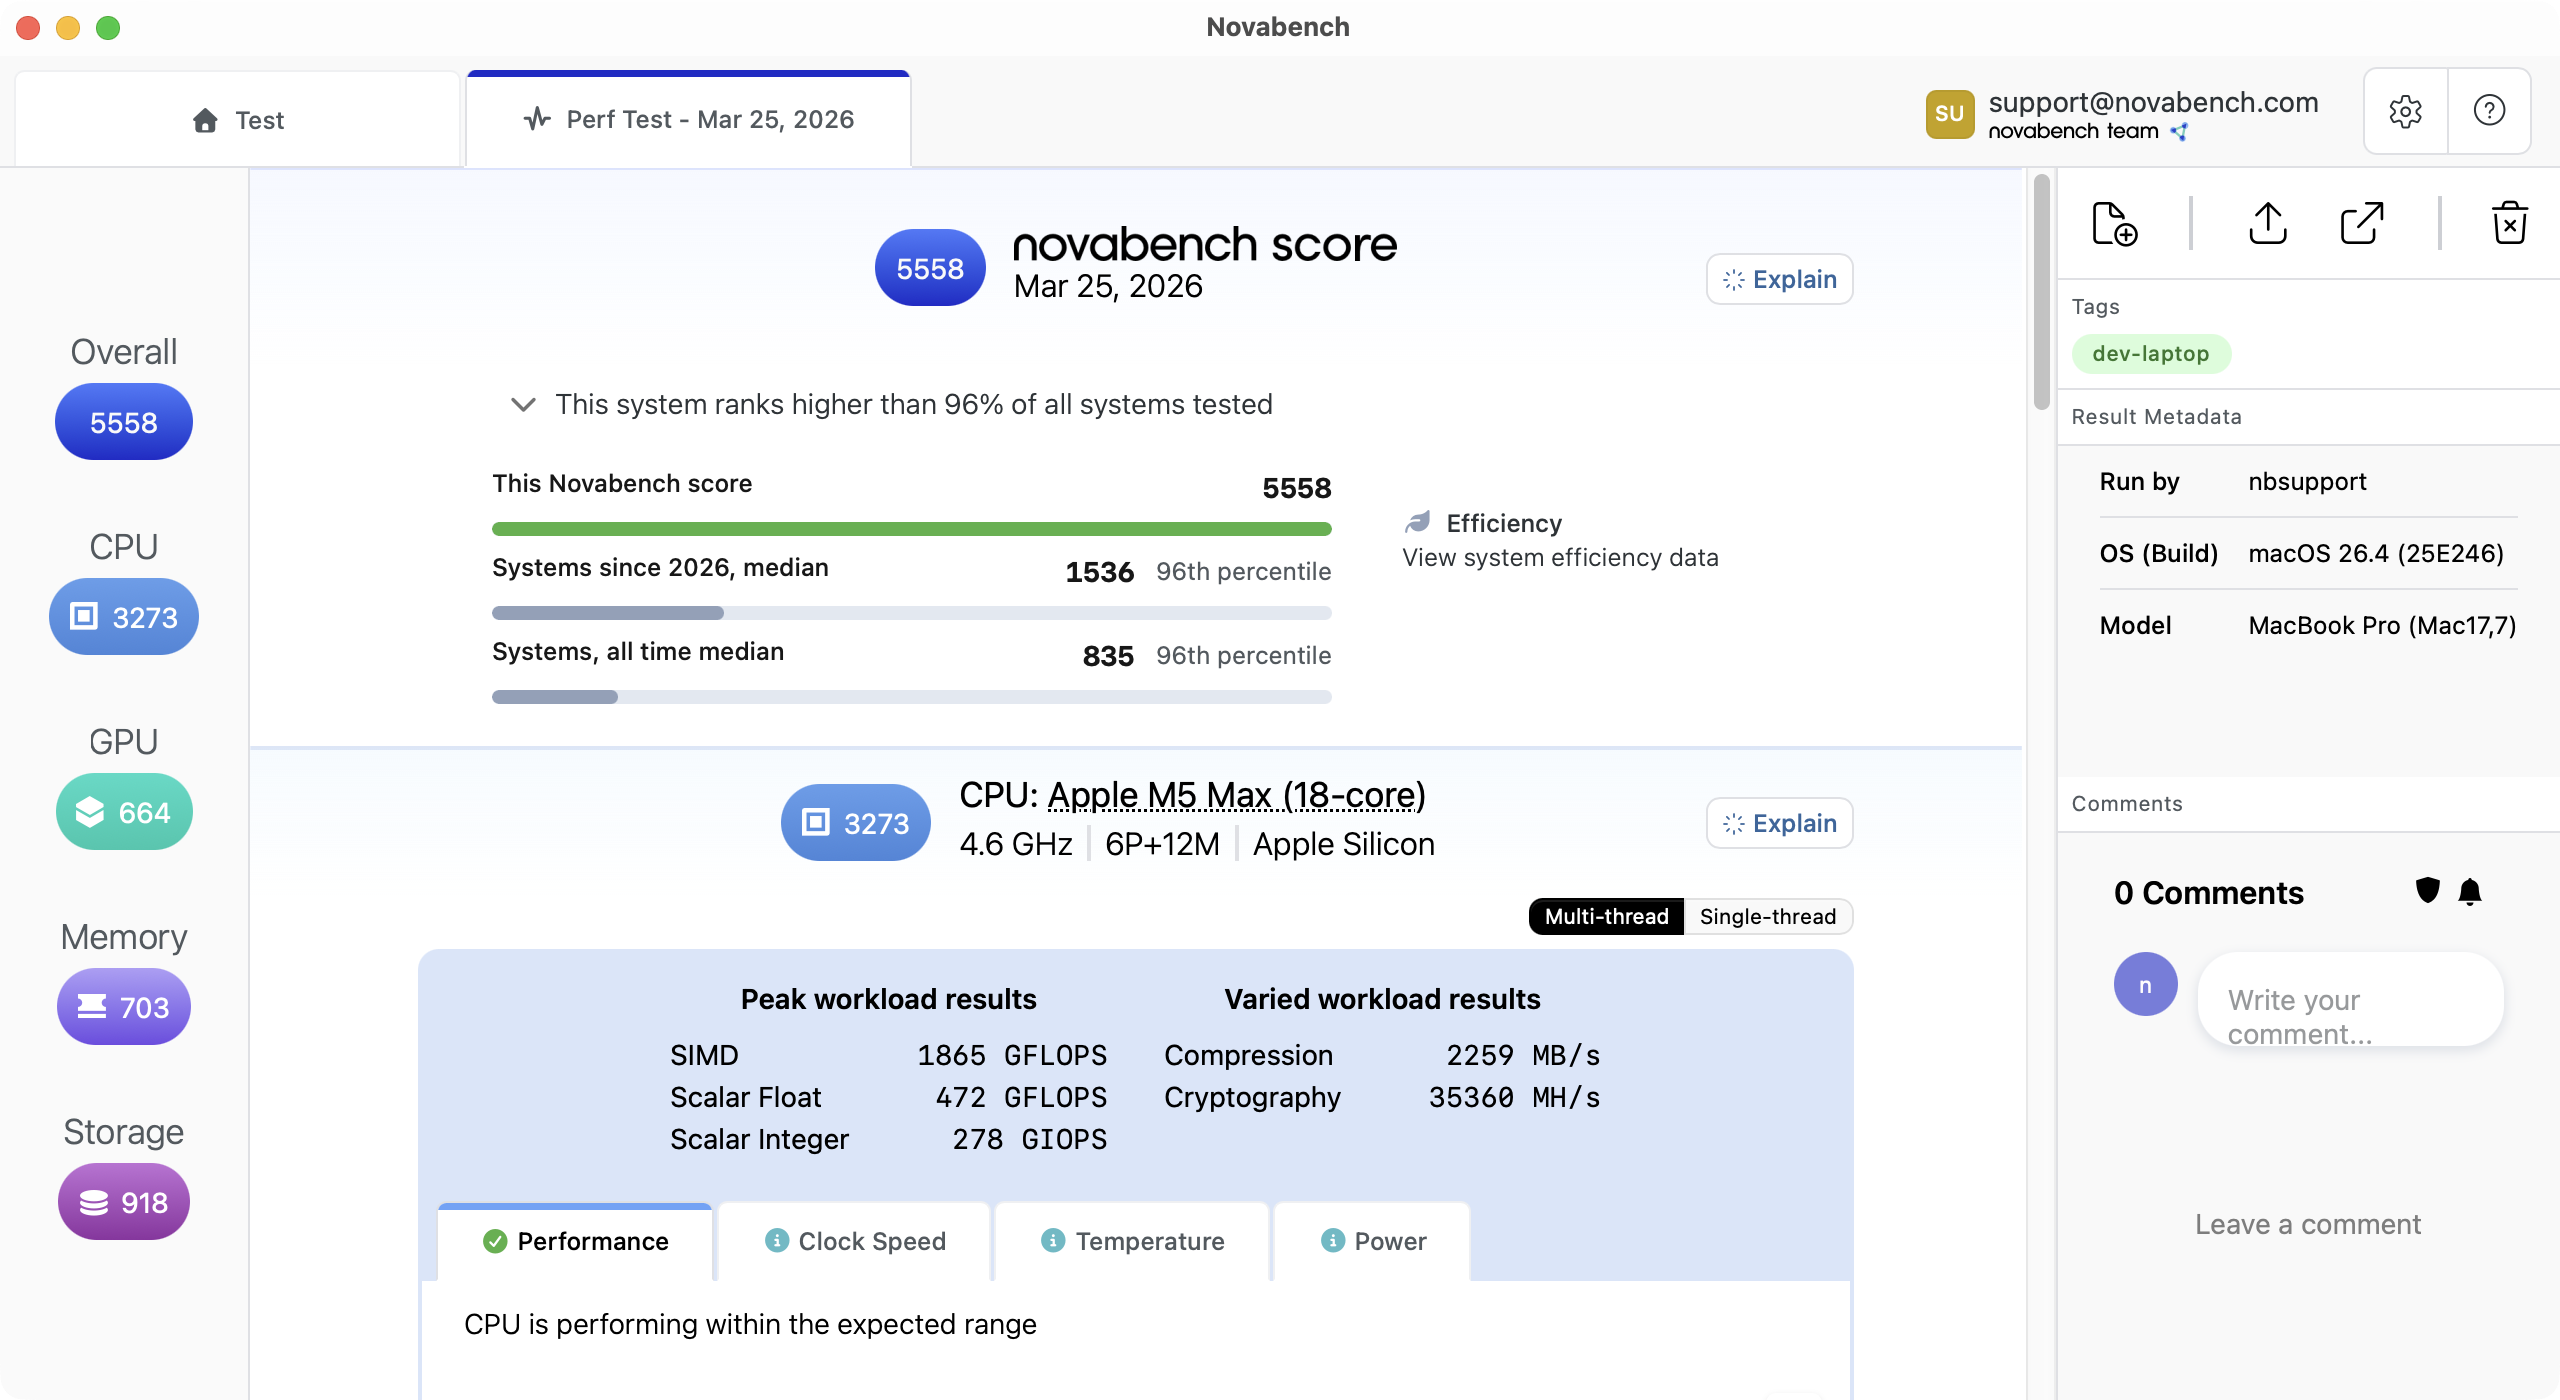
Novabench runs four workload types that exercise different parts of the storage subsystem. Individual test results roll up to a top-level score that reflects a balanced performance profile for general comparison.
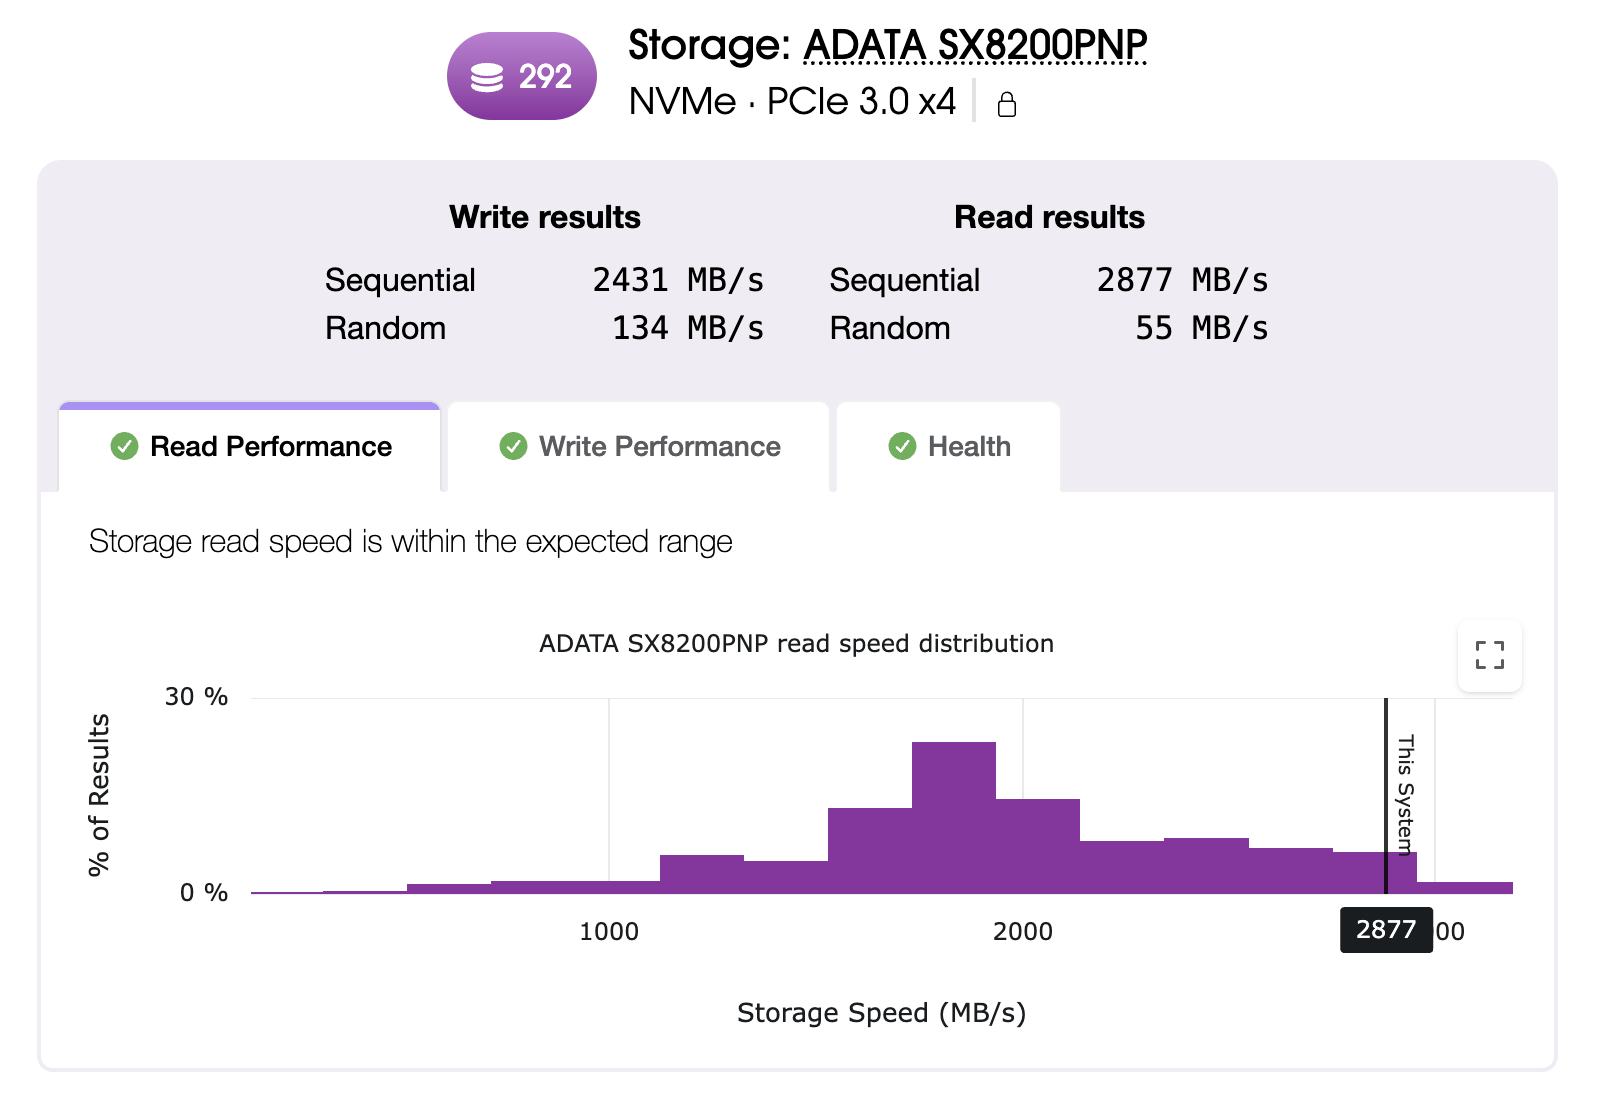
- Sequential read and write throughput for large-file operations like copies, backups, and media playback, reported in MB/s
- Random read and write performance for the small, scattered I/O behind boot, app launch, and database operations
- Drive class detection across NVMe, SATA SSD, and HDD, so comparisons stay apples-to-apples across drive types
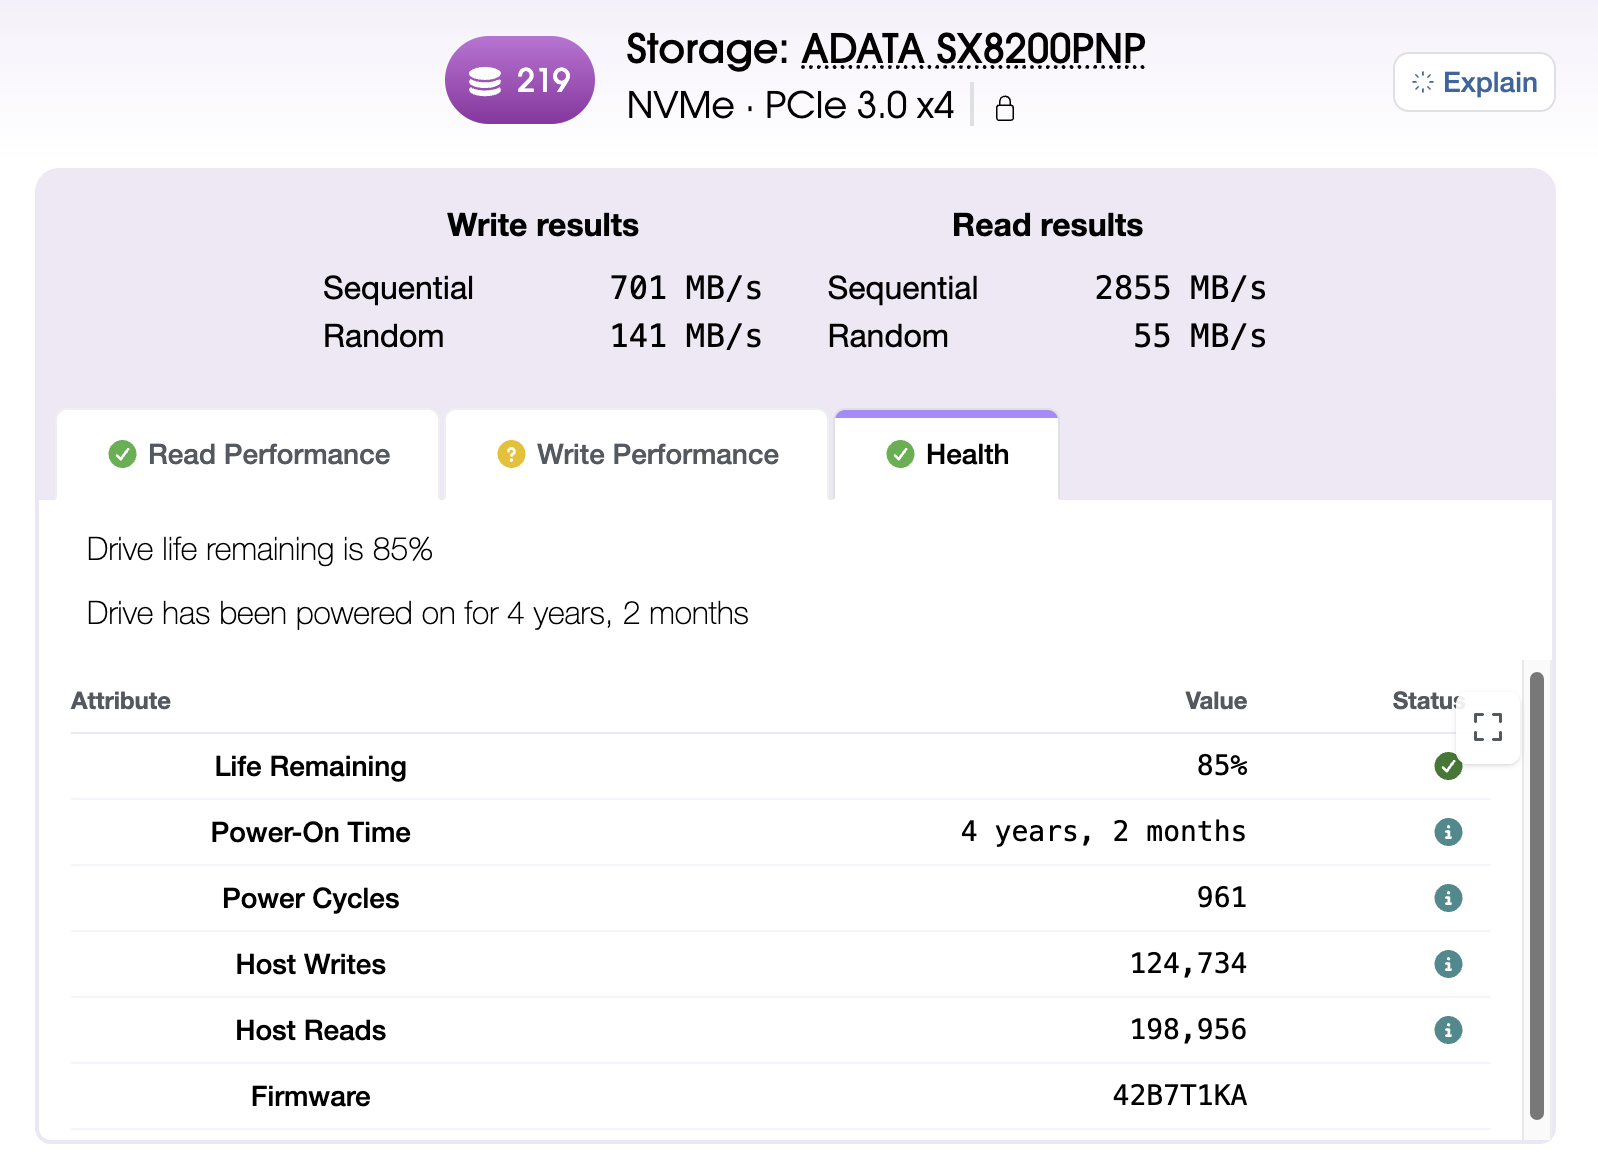
See drive health alongside performance
S.M.A.R.T. (Self-Monitoring, Analysis, and Reporting Technology) is health data the drive's firmware reports about itself: wear, temperature, reallocated sectors, power-on hours. On supported systems, Novabench reads those values and shows them next to your benchmark score.
Compare across Windows, macOS, and Linux
Novabench storage workloads are comparable across supported platforms and drive types, running identical block sizes and queue depths through native async I/O.
How the storage benchmark works
Novabench's storage benchmark is designed around three priorities: consistent measurement, fair comparison across systems, and a balanced top-level score backed by full per-test detail.
- Warmup and calibration
- Each test starts with a warmup phase to establish a steady operating state and calibrate workload size for the system, so a fast drive and a slow drive both produce a meaningful amount of work to compare.
- Process isolation
- Each test runs in its own worker process, separate from the Novabench app. This lets the benchmark control exactly how the workload runs against the drive, without interference from the app's own UI, logging, and sensor sampling. It also keeps each test from being influenced by the one before it.
- Sequential and random access patterns
- Sequential tests use 4 MB blocks at queue depth 8 to measure large-file throughput. Random tests use 4 KB blocks at queue depth 1 to measure the small, scattered operations that drive everyday responsiveness. Together they cover what your disk actually does.
- Cross-platform test equivalence
- The block sizes, queue depths, and test patterns are identical on Windows, macOS, and Linux. Each platform uses its native async I/O API.
- Workloads and scoring
- Sequential and random results feed a score that reflects the practical impact of higher speeds. The jump from an HDD to a SATA SSD produces a large score improvement; the jump from Gen 4 NVMe to Gen 5 NVMe still scores higher but by a smaller margin, matching the real-world performance experience. The headline score is a summary for general-purpose comparison; the per-test details show how a drive handles specific workloads, and both are always shown together.
- Hardware detection and drive selection
- Every result captures the drive model, capacity, and interface. By default Novabench tests the drive that holds your temporary directory, typically the boot drive; you can point the test path at any writable folder to benchmark a secondary device.
Frequently asked questions
Yes. Novabench Free runs the full storage benchmark along with CPU, GPU, memory, and NPU tests on Windows, macOS, and Linux. Paid tiers add sensor monitoring, deeper reports, and team features.
Benchmark your storage
Download Novabench free and score your SSD, NVMe drive, or HDD in minutes on Windows, macOS, or Linux.